The Trends screen
The Trends screen brings together, in one place, the main indicators of your control over time. At the top, you can switch the period between 7, 15, 30, and 90 days.
The 90-day period is a Diablesse Pro feature.
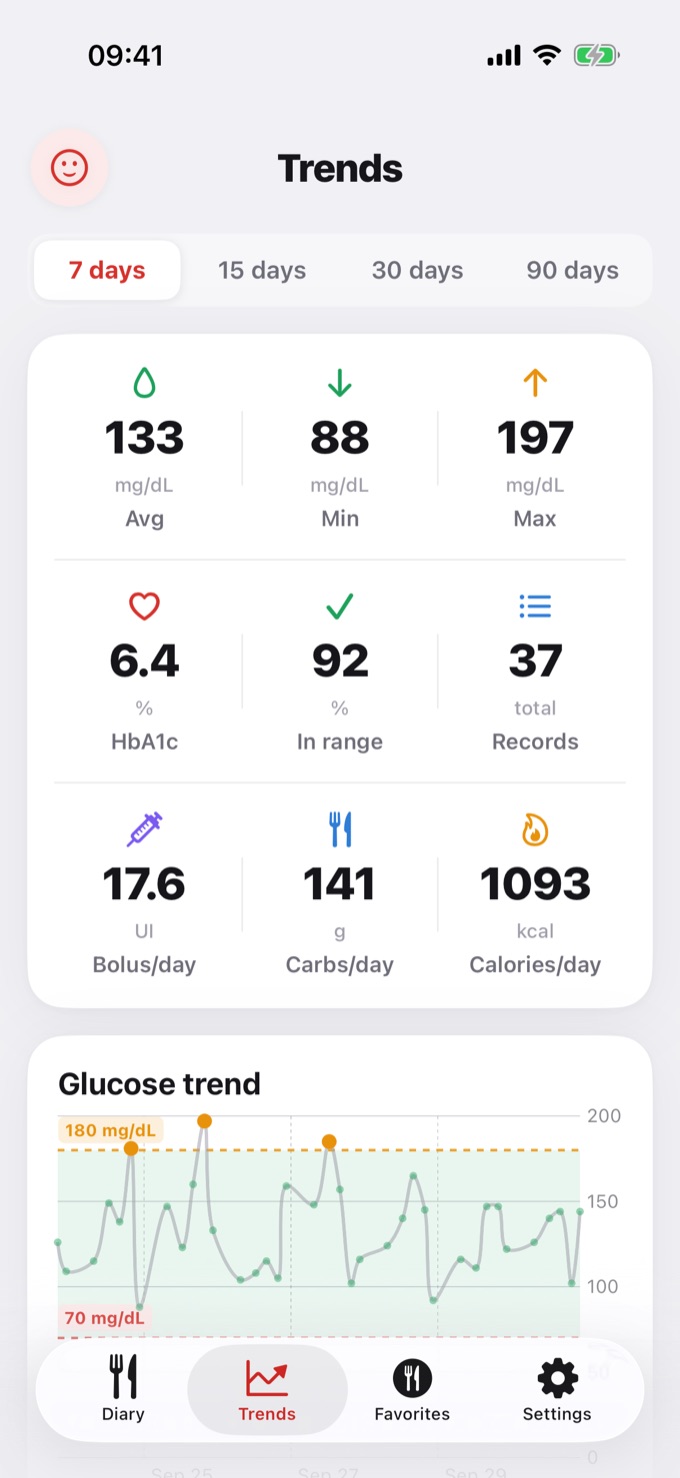
Main indicators
| Indicator | What it shows |
|---|---|
| Average, Min., and Max. | Average, minimum, and maximum glucose for the period (mg/dL) |
| HbA1c | Estimated HbA1c based on your glucose readings |
| In range | Percentage of readings within the target range |
| Records | Total number of records in the period |
| Bolus/day | Daily average insulin (units) |
| Carbs/day | Daily average carbohydrates (g) |
| Calories/day | Daily average calories (kcal) |
Glucose trend
A chart shows your glucose over the period, with the target range highlighted (70 to 180 mg/dL by default). Points outside the range are emphasized.
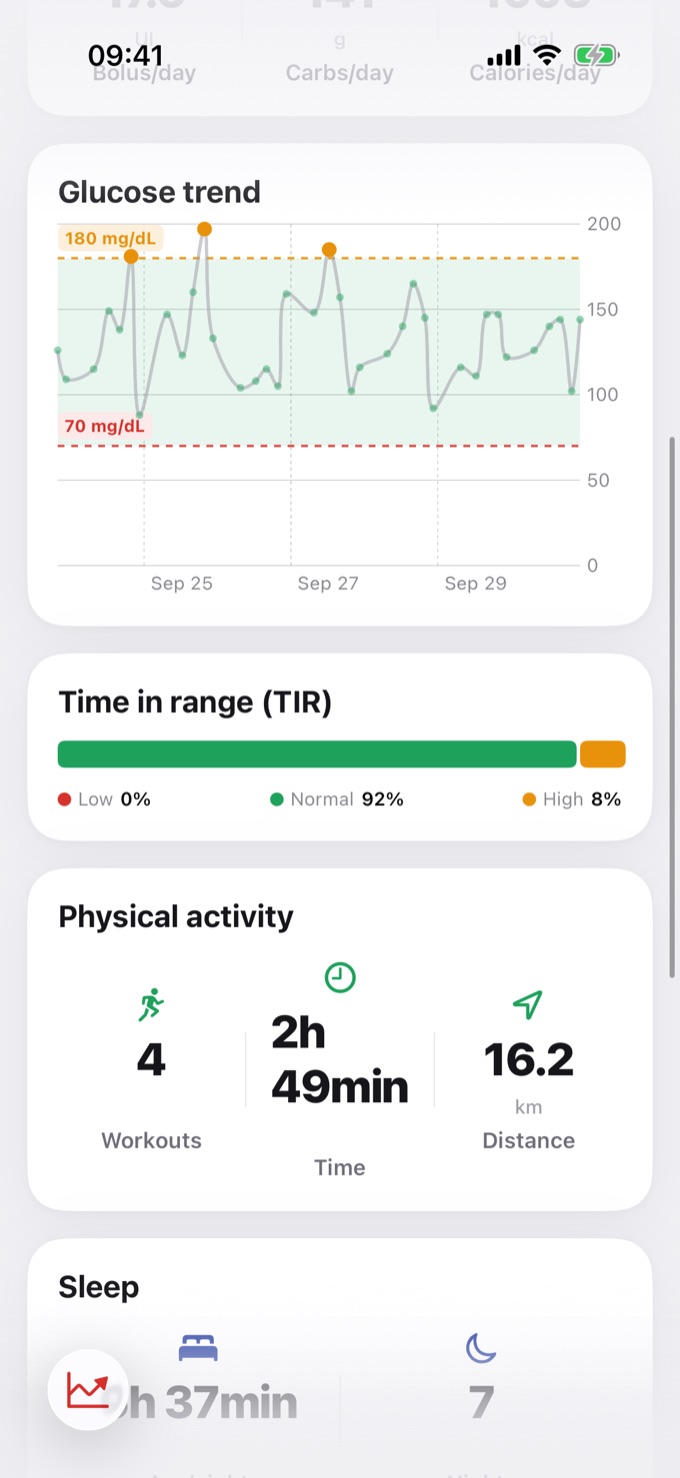
Time in Range (TIR)
A bar shows the share of the period your glucose was low, in range, and high, as percentages.
Activity and sleep
When you connect Apple Health or Health Connect, Trends also shows:
- Physical activity — number of workouts, total time, and distance
- Sleep — average per night and number of nights recorded
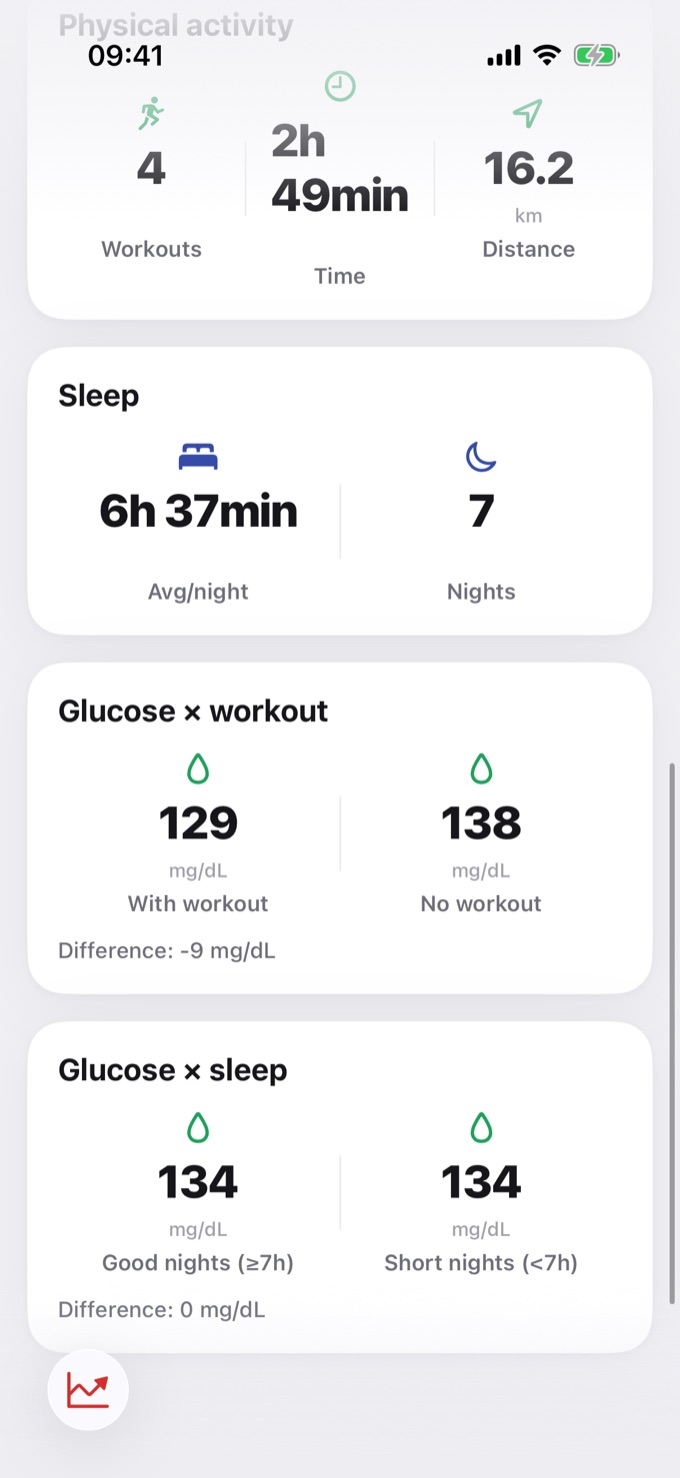
Comparisons
To help you spot patterns, Trends cross-references your glucose with your routine:
- Glucose × workout — average with and without workouts, and the difference between them
- Glucose × sleep — average on good nights (≥ 7h) and on poor nights (< 7h), and the difference
💡 The more complete your records and integrations are, the richer these indicators become. Remember that the estimated HbA1c is an estimate and does not replace the laboratory test.